| |
|



 |
The Foresters  2006-07 Season 2006-07 Season  Statistical Leaders Statistical Leaders
| |
2006-07 Statistical Leaders . . . |
|
| |
For statistics of all players (with MCC rankings), see the Forester Statistics page.

For team and player rankings in all of NAIA D2, see the NAIA Comparisons page.
|
| |
2006-07 MCC Conference Champions and MCC Tournament Champions

|
Huntington
2006-07 Statistical Leaders |
|
As of 3/8/07 - |
34 of 34 games |
|
|
|
|
|
| Points Scored |
Points per Game |
Total Assists |
Assists per Game |
| 1. A. Kock - 796 |
1. A. Kock - 23.4 |
1. J. Yoder - 200 |
1. J. Yoder - 5.9 |
| 2. K. Ganton - 638 |
2. K. Ganton - 18.8 |
2. A. Kock - 112 |
2. A. Kock - 3.3 |
| 3. D. Sheckler - 440 |
3. D. Sheckler - 12.9 |
3. D. Sheckler - 65 |
3. K. Benge - 2.0 |
| 4. K. Benge - 242 |
4. K. Benge - 9.7 |
4. K. Ganton - 50 |
4. D. Sheckler - 1.9 |
| 5. J. Yoder - 221 |
5. J. Yoder - 6.5 |
5. K. Benge - 50 |
5. Several - 1.5 |
|
|
|
|
| Field Goals Made |
Field Goal Attempts |
Field Goals per Game |
Field Goal % (min 3A/G) |
| 1. A. Kock - 307 |
1. A. Kock - 557 |
1. A. Kock - 9.0 |
1. A. Kock - 55.1% |
| 2. K. Ganton - 211 |
2. K. Ganton - 404 |
2. K. Ganton - 6.2 |
2. K. Ganton - 52.2% |
| 3. D. Sheckler - 172 |
3. D. Sheckler - 340 |
3. D. Sheckler - 5.1 |
3. D. Sheckler - 50.6% |
| 4. K. Benge - 85 |
4. K. Benge - 196 |
4. K. Benge - 3.4 |
4. L. Smith - 48.5% |
| 5. Several - 64 |
5. J. Yoder - 146 |
5. Several - 1.9 |
5. J. Yoder - 43.8% |
|
|
|
|
| 3-Point FGs Made |
3-Point FG Attempts |
3-Point FGs per Game |
3-Point FG % (min 2A/G) |
| 1. K. Ganton - 71 |
1. K. Ganton - 153 |
1. K. Ganton - 2.1 |
1. J. Yoder - 49.4% |
| 2. A. Kock - 60 |
2. A. Kock - 134 |
2. A. Kock - 1.8 |
2. K. Ganton - 46.4% |
| 3. J. Yoder - 38 |
3. K. Benge - 85 |
3. K. Benge - 1.4 |
3. A. Kock - 44.8% |
| 4. K. Benge - 34 |
4. J. Yoder - 77 |
4. J. Yoder - 1.1 |
4. K. Benge - 40.0% |
| 5. L. Smith - 16 |
5. L. Smith - 47 |
5. L. Smith - 0.5 |
No Others Qualified |
|
|
|
|
| Free Throws Made |
Free Throw Attempts |
Free Throws per Game |
Free Throw % (min 1A/G) |
| 1. K. Ganton - 145 |
1. K. Ganton - 161 |
1. K. Ganton - 4.3 |
1. K. Ganton - 90.1% |
| 2. A. Kock - 122 |
2. A. Kock - 146 |
2. A. Kock - 3.6 |
2. A. Kock - 83.6% |
| 3. D. Sheckler - 82 |
3. D. Sheckler - 116 |
3. D. Sheckler - 2.4 |
3. K. Benge - 82.6% |
| 4. J. Yoder - 55 |
4. J. Yoder - 67 |
4. J. Yoder - 1.6 |
4. J. Yoder - 82.1% |
| 5. K. Kyle - 41 |
5. K. Kyle - 57 |
5. K. Benge - 1.5 |
5. K. Kyle - 71.9% |
|
|
|
|
| Offensive Rebounds |
Off Rebs per Game |
Defensive Rebounds |
Def Rebs per Game |
| 1. A. Kock - 63 |
1. A. Kock - 1.9 |
1. A. Kock - 276 |
1. A. Kock - 8.1 |
| 2. D. Sheckler - 56 |
2. K. Ganton - 1.6 |
2. D. Sheckler - 124 |
2. D. Sheckler - 3.6 |
| 3. K. Ganton - 53 |
3. D. Sheckler - 1.6 |
3. K. Ganton - 116 |
3. K. Ganton - 3.4 |
| 4. K. Kyle - 37 |
4. K. Kyle - 1.1 |
4. J. Yoder - 69 |
4. J. Yoder - 2.0 |
| 5. J. Haifley - 18 |
5. Several - 0.5 |
5. L. Smith - 51 |
5. Several - 1.5 |
|
|
|
|
| Total Rebounds |
Total Rebs per Game |
Total Blocks |
Blocks per Game |
| 1. A. Kock - 339 |
1. A. Kock - 10.0 |
1. D. Sheckler - 55 |
1. D. Sheckler - 1.6 |
| 2. D. Sheckler - 180 |
2. D. Sheckler - 5.3 |
2. A. Kock - 32 |
2. A. Kock - 0.9 |
| 3. K. Ganton - 169 |
3. K. Ganton - 5.0 |
3. K. Kyle - 9 |
3. K. Kyle - 0.3 |
| 4. K. Kyle - 87 |
4. K. Kyle - 2.6 |
4. L. Smith - 5 |
4. L. Smith - 0.2 |
| 5. J. Yoder - 79 |
5. J. Yoder - 2.3 |
5. K. Ganton - 5 |
5. Several - 0.1 |
|
|
|
|
| Total Steals |
Total Turnovers |
Assist/Turnover Ratio |
Double Doubles |
| 1. D. Sheckler - 35 |
1. A. Kock - 81 |
1. J. Yoder - 2.6 |
1. A. Kock - 20 |
| 2. K. Ganton - 29 |
2. J. Yoder - 76 |
2. B. Haifley - 2.0 |
2. D. Sheckler - 3 |
| 3. J. Haifley - 29 |
3. L. Smith - 50 |
3. D. Sheckler - 1.6 |
3. K. Ganton - 1 |
| 4. J. Yoder - 26 |
4. K. Benge - 45 |
4. J. Haifley - 1.6 |
No Others Qualified |
| 5. A. Kock - 26 |
5. K. Ganton - 42 |
5. A. Kock - 1.4 |
|
|
|
|
|
| Steals per Game |
Lo TOs/G (min 75% Gs) |
Hi TO/G (no min Gs) |
Total Fouls |
| 1. D. Sheckler - 1.0 |
1. K. Kyle - 0.47 |
1. A. Kock - 2.4 |
1. D. Sheckler - 114 |
| 2. K. Ganton - 0.9 |
2. J. Haifley - 0.71 |
2. J. Yoder - 2.2 |
2. J. Yoder - 89 |
| 3. J. Haifley - 0.9 |
3. D. Sheckler - 1.18 |
3. R. Thornton - 2.0 |
3. K. Ganton - 80 |
| 4. J. Yoder - 0.8 |
4. K. Ganton - 1.24 |
4. K. Benge - 1.8 |
4. A. Kock - 78 |
| 5. A. Kock - 0.8 |
5. L. Smith - 1.52 |
5. L. Smith - 1.5 |
5. L. Smith - 52 |
|
|
|
|
| Points/Min. (min 5 M/G) |
FGs/Min. (min 5 M/G) |
3P FGs/Min. (min 5 M/G) |
Assist/Min. (min 5 M/G) |
| 1. A. Kock - 0.645 |
1. A. Kock - 0.249 |
1. K. Ganton - 0.060 |
1. J. Yoder - 0.177 |
| 2. K. Ganton - 0.543 |
2. K. Ganton - 0.180 |
2. K. Benge - 0.059 |
2. A. Kock - 0.091 |
| 3. D. Sheckler - 0.445 |
3. D. Sheckler - 0.174 |
3. A. Kock - 0.049 |
3. K. Benge - 0.087 |
| 4. K. Benge - 0.420 |
4. K. Benge - 0.148 |
4. J. Yoder - 0.034 |
4. J. Haifley - 0.083 |
| 5. K. Kyle - 0.278 |
5. L. Smith - 0.092 |
5. J. Haifley - 0.024 |
5. L. Smith - 0.071 |
|
|
|
|
| Tot Reb/Min. (min 5 M/G) |
Lo TOs/Min. (min 5 Min/G) |
Hi TOs/Min. (min 5 M/G) |
Fouls/Min. (no minimum) |
| 1. A. Kock - 0.274 |
1. K. Ganton - 0.036 |
1. K. Benge - 0.078 |
1. B. Haifley - 0.158 |
| 2. K. Kyle - 0.210 |
2. K. Kyle - 0.039 |
2. L. Smith - 0.072 |
2. D. Sheckler - 0.115 |
| 3. D. Sheckler - 0.182 |
3. D. Sheckler - 0.040 |
3. J. Yoder - 0.067 |
3. N. Stoffel - 0.114 |
| 4. K. Ganton - 0.144 |
4. J. Haifley - 0.052 |
4. A. Kock - 0.066 |
4. K. Kyle - 0.109 |
| 5. J. Haifley - 0.131 |
5. A. Kock - 0.066 |
5. J. Haifley - 0.052 |
5. J. Yoder - 0.079 |
|
|
|
|
GO FORESTERS!

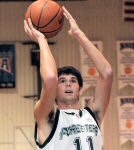
(Photos Courtesy of Huntington University) |
|
|


 2006-07 Season
  Statistical Leaders